> For the complete documentation index, see [llms.txt](https://python.cyberdefendersprogram.com/llms.txt). Markdown versions of documentation pages are available by appending `.md` to page URLs; this page is available as [Markdown](https://python.cyberdefendersprogram.com/python-data-science-security-data-analysis.md).
# 4. Python Data Science - Security Data Analysis
In this section, we are going to concentrate on the data science programming aspect of Python, which will be necessary to understand the role of machine learning in cyber security. Let’s first try to understand how data science and cybersecurity are related.
## So, why do I need to know data science for security?
For a hacker, gaining access to a network might not be the biggest challenge. The challenge will be to figure out where they are once they are inside the network and to crawl through and attack the system. In this phase, which is usually known as the “recon” phase, they mostly leave traces of their location or of who they are.
This information can be extracted and this might be one of the places where data science can be leveraged. Through this, we can also correlate with multiple events that has already occurred and find similarities to figure out a pattern and relate.
## Does this mean that data science is the solution for all the attacks?
It can be! But, the challenge is that we have loads of data related to the cyber security field and ‘no labels’, which is absolutely the biggest challenge for leveraging machine learning to make decisions. Few of the major applications where currently we successfully leverage this is:
* Anomaly Detection
* Malware Analysis
* Network Traffic Analysis
With that being said, let us begin to explore data analysis with Python!
## Learning Goals
* Familiarity with using Pandas data structure
* Analyzing a specific dataset using Pandas
* Practice problem to get hands-on with the material
**Learning Time: 1.5 hours**
In our last post, we already saw how to use Pandas to read a text file. As already discussed, this package plays a huge role in various security applications, where machine learning is leveraged for analysis and detection of attacks. Now, let us dig a little deeper and understand the manipulations that can be performed on the data using Pandas.
## Data Selection using data structures in Pandas
There are two main fundamental data structures predominantly used with the Pandas library:
* **Series**
* **DataFrames**
According the pydata.org, a Pandas DataFrame is a “two-dimensional size-mutable, potentially heterogeneous tabular data structure with labeled axes”. In short, these act like a collection of the series data structure which can also hold data of different types in rows and columns format sharing the same index and it’s size can also be modified. To understand this better, let us see how to use a Series data structure (can be considered as a one-dimensional array) and the type of manipulations that can be performed on it.
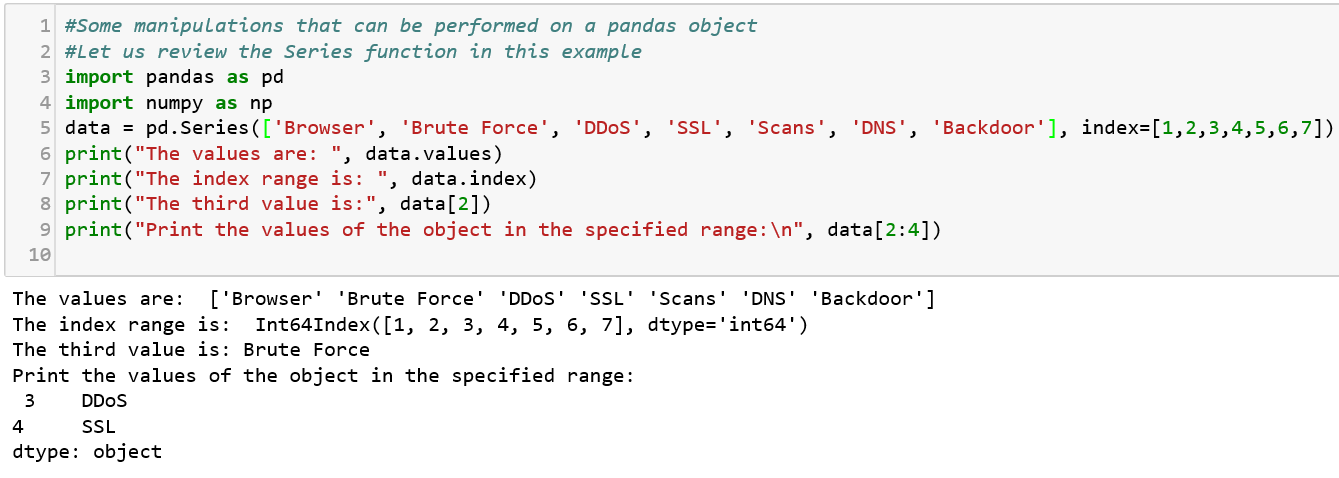
### Series
A Series structure is similar to an array, list, or column in a table. It will assign a labeled index to each item starting from 0.
Now that we have covered the Series data structure, let us dive into the other structure — DataFrames.
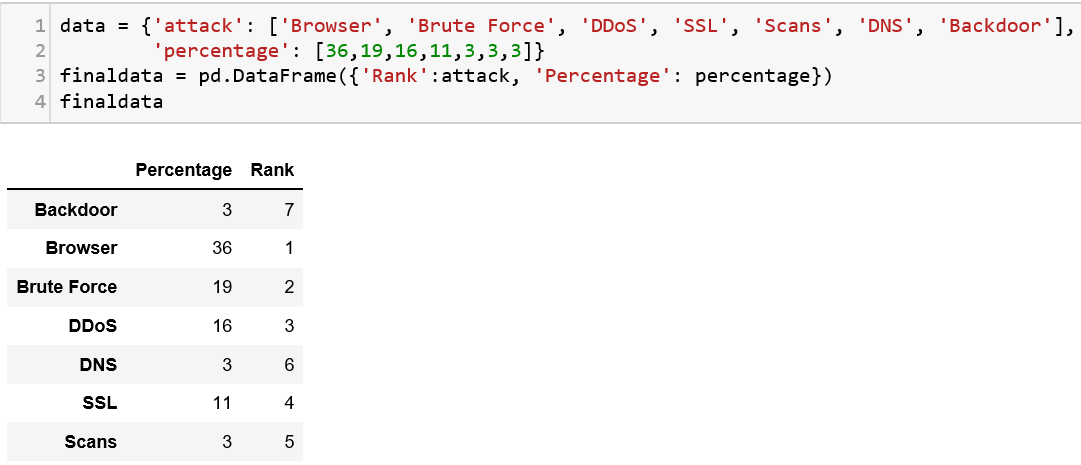
### DataFrames
A DataFrame structure looks similar to a spreadsheet or database table. Let us try to understand this structure with an example. We are going to pass a dictionary of lists to the DF constructor and display the content.
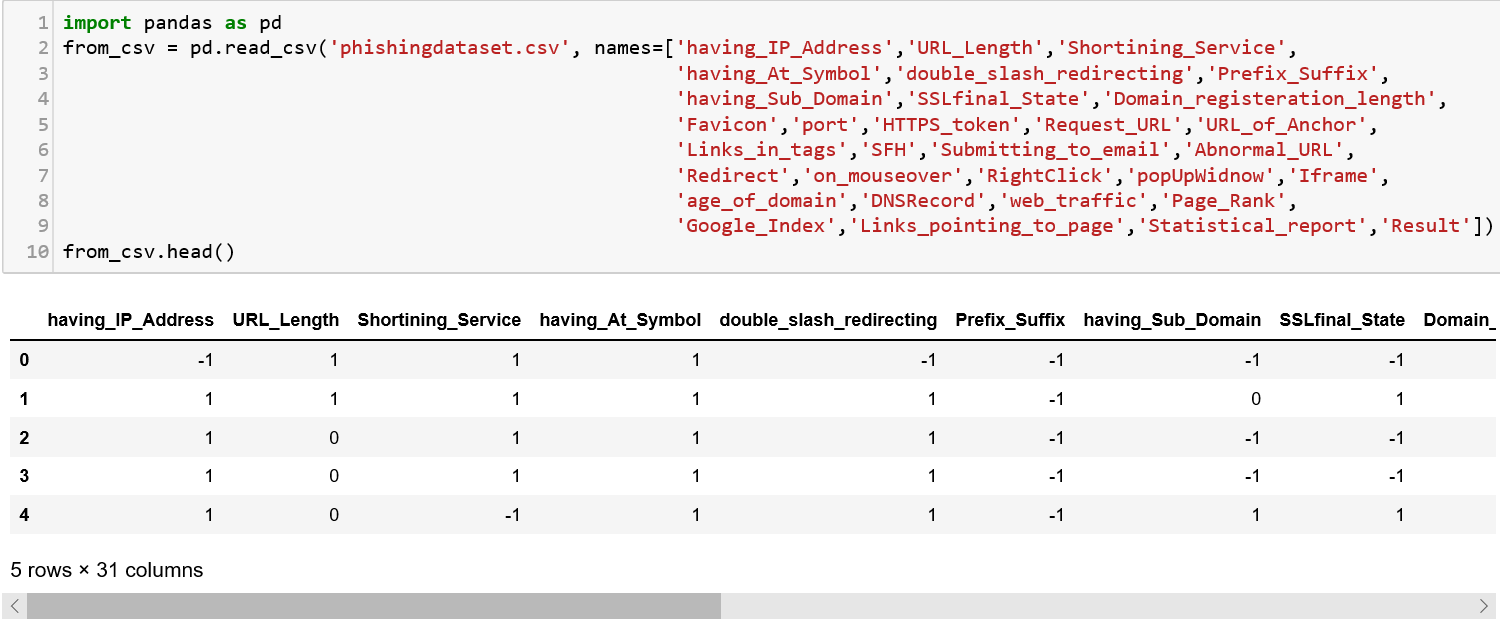
## Reading a file
Let us download the Phishing dataset from the below mentioned website and save it as a csv file.[Index of /ml/machine-learning-databases/00327Edit descriptionarchive.ics.uci.edu](https://archive.ics.uci.edu/ml/machine-learning-databases/00327/)
I removed the attribute information from the file and retained the data part. The headers are set when reading the csv into the pandas object using the ‘names’ attribute. You can find a description of the dataset in that link as well.
## Manipulations on a Pandas DataFrame
There are a lot of useful functions that can be used on a DataFrame object for manipulation. Let us discuss a few of those here.
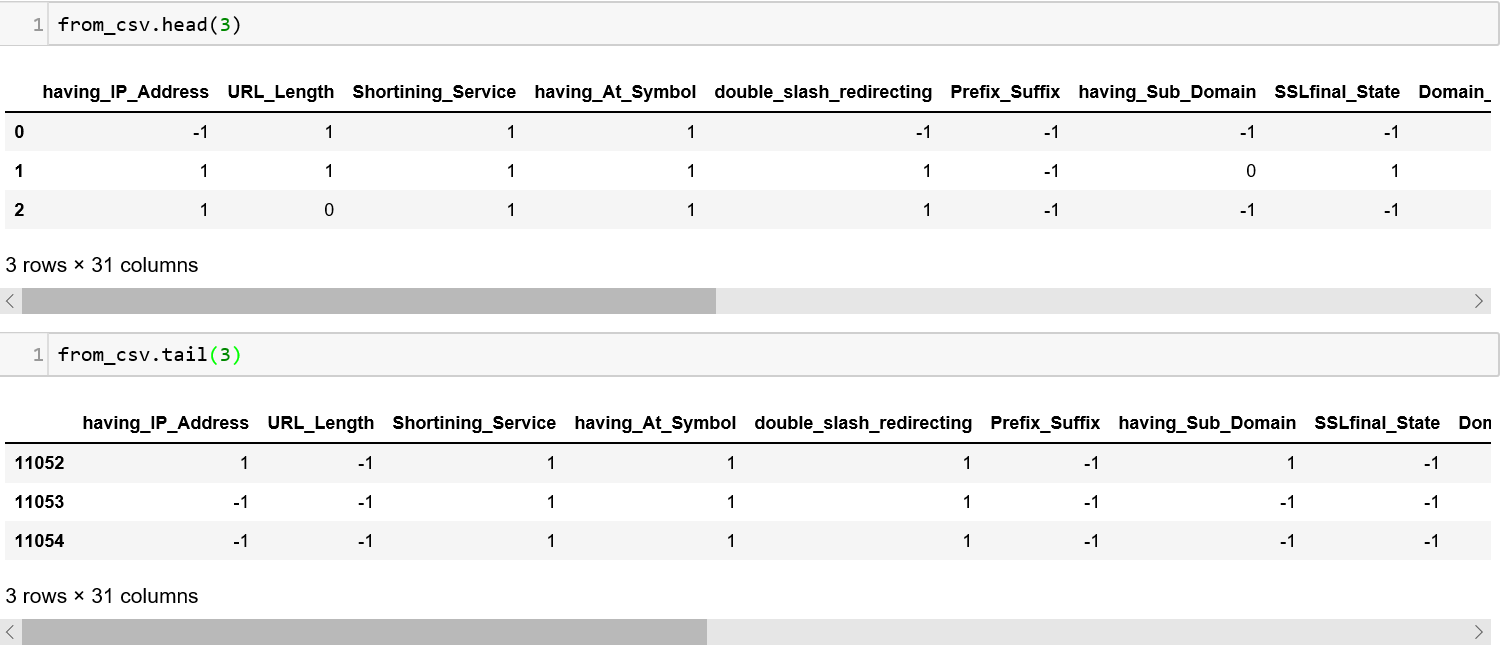
1. The **head()** and **tail()** method can be used to see the values at the beginning and end of the dataframe. You can also pass a number to these methods to specify the number of lines you want to see.
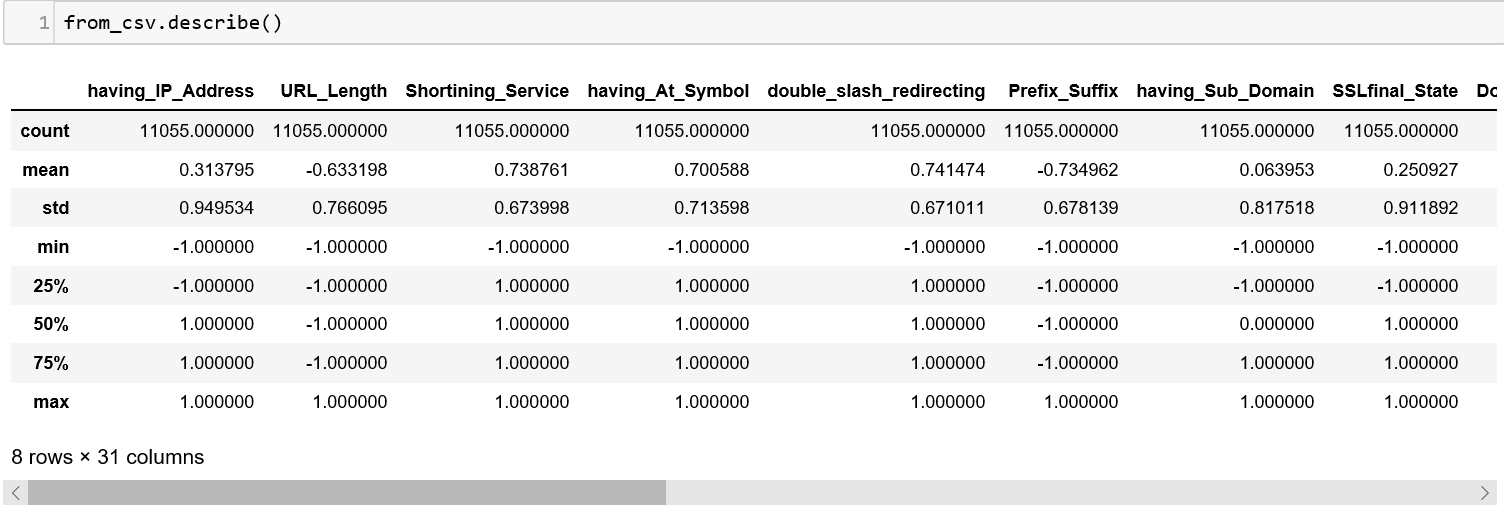
2\. The describe() method will summarize all columns that contain numbers and give you the count, mean, minimum, maximum, etc.
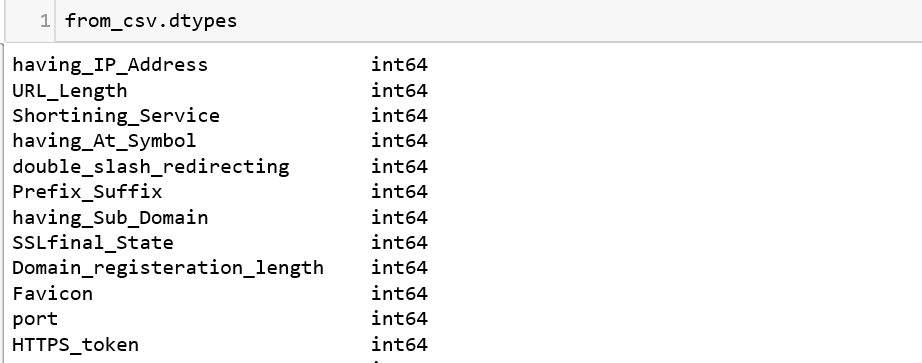
3\. The \.dtypes command should give what type of information Python has stored in each column of the frame.
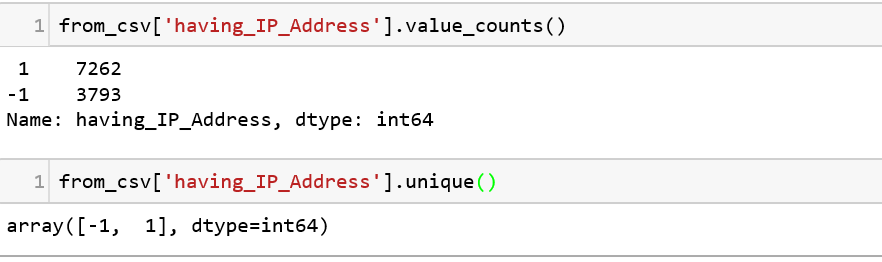
To explore this further, we have two other functions value\_counts() and unique().
* value\_counts() the count of the different values that exist in the column.
* unique() gives you the details of the unique values that exists in the column.
**Note**: NaN stands for “Not a Number” and is a special value assigned to empty column values.
4\. When we are working with data and run into NaN values, these generally do not add value for analysis. So, these can be removed from the dataframe as part of the preprocessing phase.
Additionally, we can also add columns to the dataframe. Adding columns might be a scenario where when the selected features do not add value by itself but when combined with other features and formed as a new column, can be more useful. Let us not worry too much about these concepts for now!

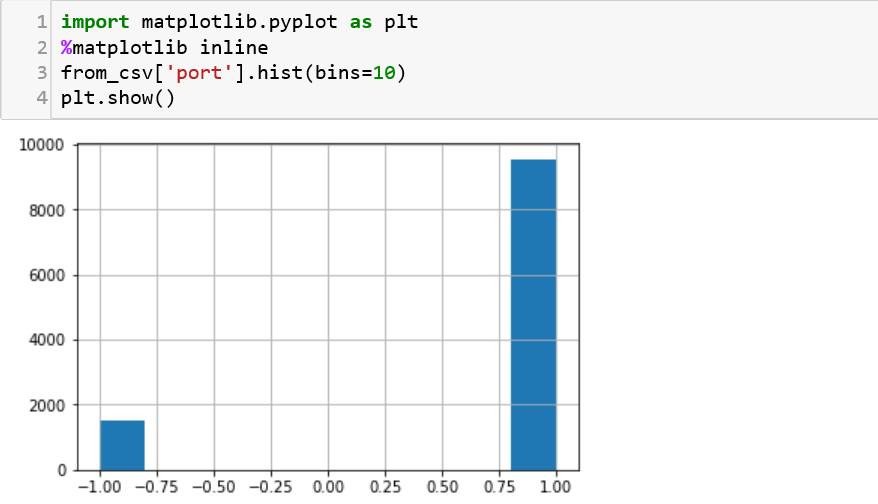
5\. To visualize the distribution, we can use matplotlib, just like we have used it previously in Lesson 2. Here, we are trying to display a histogram of the values available in the port column. One need to know is that visualization might play a huge role in trying to analyze clusters of data to show us if there is ‘over-fitting’ in a model. This concept is something we might run into during data analysis.
6\. We can even read directly from a URL and put the information into a data table using Pandas. This is just a simple piece of code to read a URL.
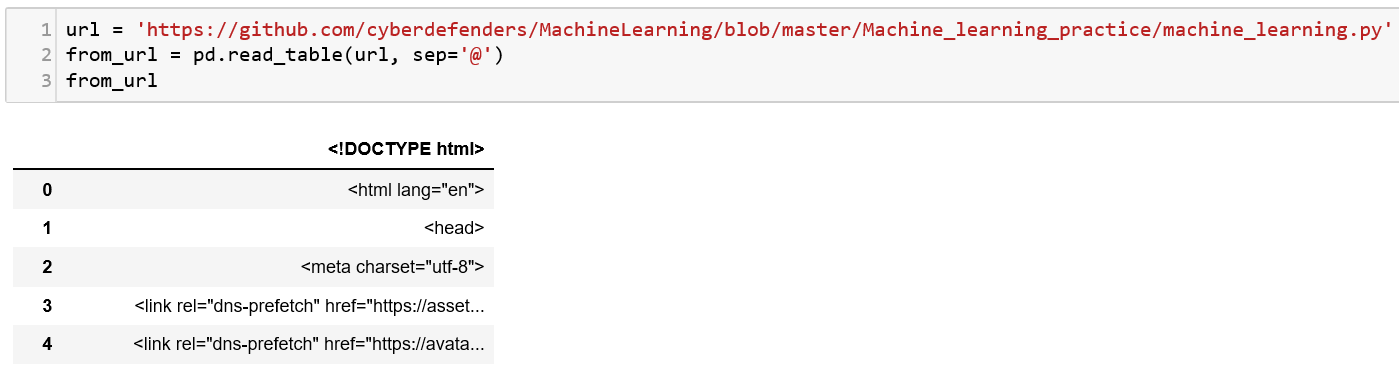
You can also read and write from a database like Sqlite, SqlAlchemy or MySQL using Pandas.
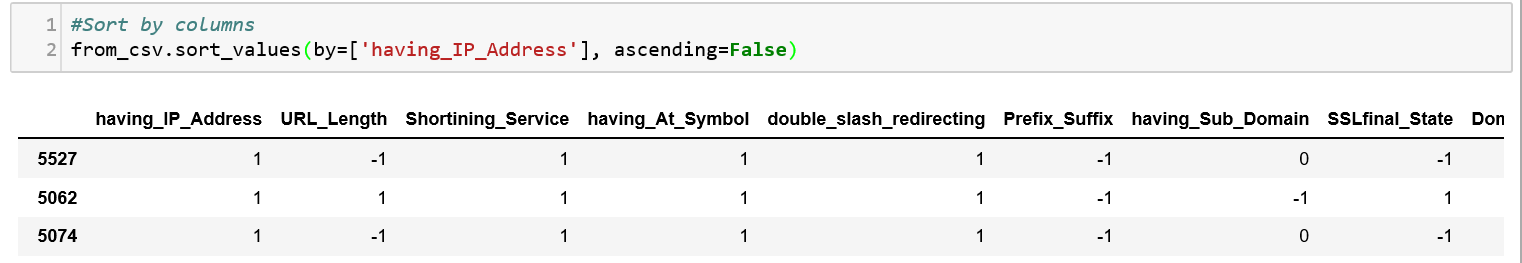
7\. We can sort the data using the columns using the sort\_values() function.
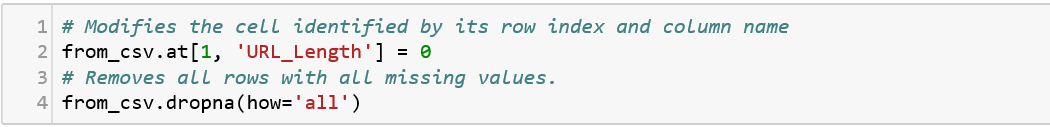
8\. Modifying the fields in a column present in a dataframe is very easy with Pandas. For instance, we can drop all the values that have empty fields using the dropna() function.
These are just a collection of a few things that we can do with Pandas. There is an ocean of things that we can analyze with this powerful package and a few others can be read from the resources mentioned below.
Watch out for the next lesson in the web series!
Happy Learning!
## Practice
* Try to do all the functions that was done above on any cybersecurity dataset of your choice!
## Additional Resources
1. To know more about data science plans an important role in security, this blog is a great source:
2. Another great resource for learning more about Pandas for data analysis:
3. This is a great tutorial video to understand Pandas:
4. Some useful snippets for coding in Pandas: